
We worked hard to make sure the Cypress Test Runner could be compatible with every continuous integration system. Jenkins, Travis, Circle, Zeit Now, Google Cloud Build, or your own homegrown CI system - they should all work with zero or minimum effort. We also worked hard to make our Dashboard Service particularly useful in collecting and showing all of your test artifacts in a single place.
Test artifacts
When you execute cypress run, the end-to-end tests produce artifacts for each spec file ran: videos of the tests run, standard output, and screenshots. If a test fails, these artifacts become invaluable when analyzing the test failure. But how do you access these artifacts? How are they presented? Are they even stored?
Some CI systems do not store artifacts by default (for example Travis or Zeit Now). Every CI system that does store them, stores them differently. To provide a really good experience managing your tests we have created the Cypress Dashboard - a service that can receive output test data from the Test Runner and present it to your team in an unified and useful way. It goes well beyond the simple “green / red” view each CI gives you: because the Cypress Dashboard understands the structure of the test data, it can show everything there is to understand about each test, its history and its performance.
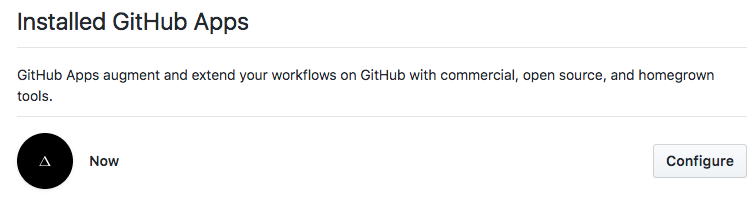
Let’s take Zeit Now for GitHub for example. I have a small example repo at bahmutov/tiny-blog where I have set up a Now GitHub application to build and host every pull request.
I have written a Dockerfile that runs Cypress end-to-end tests, but does NOT include Cypress dependencies and tests in the production image, see this blog post for explanation. This keeps the output image very very small and fast to deploy. A typical pull request gets built from the project’s Dockerfile and gets hosted behind a unique URL.
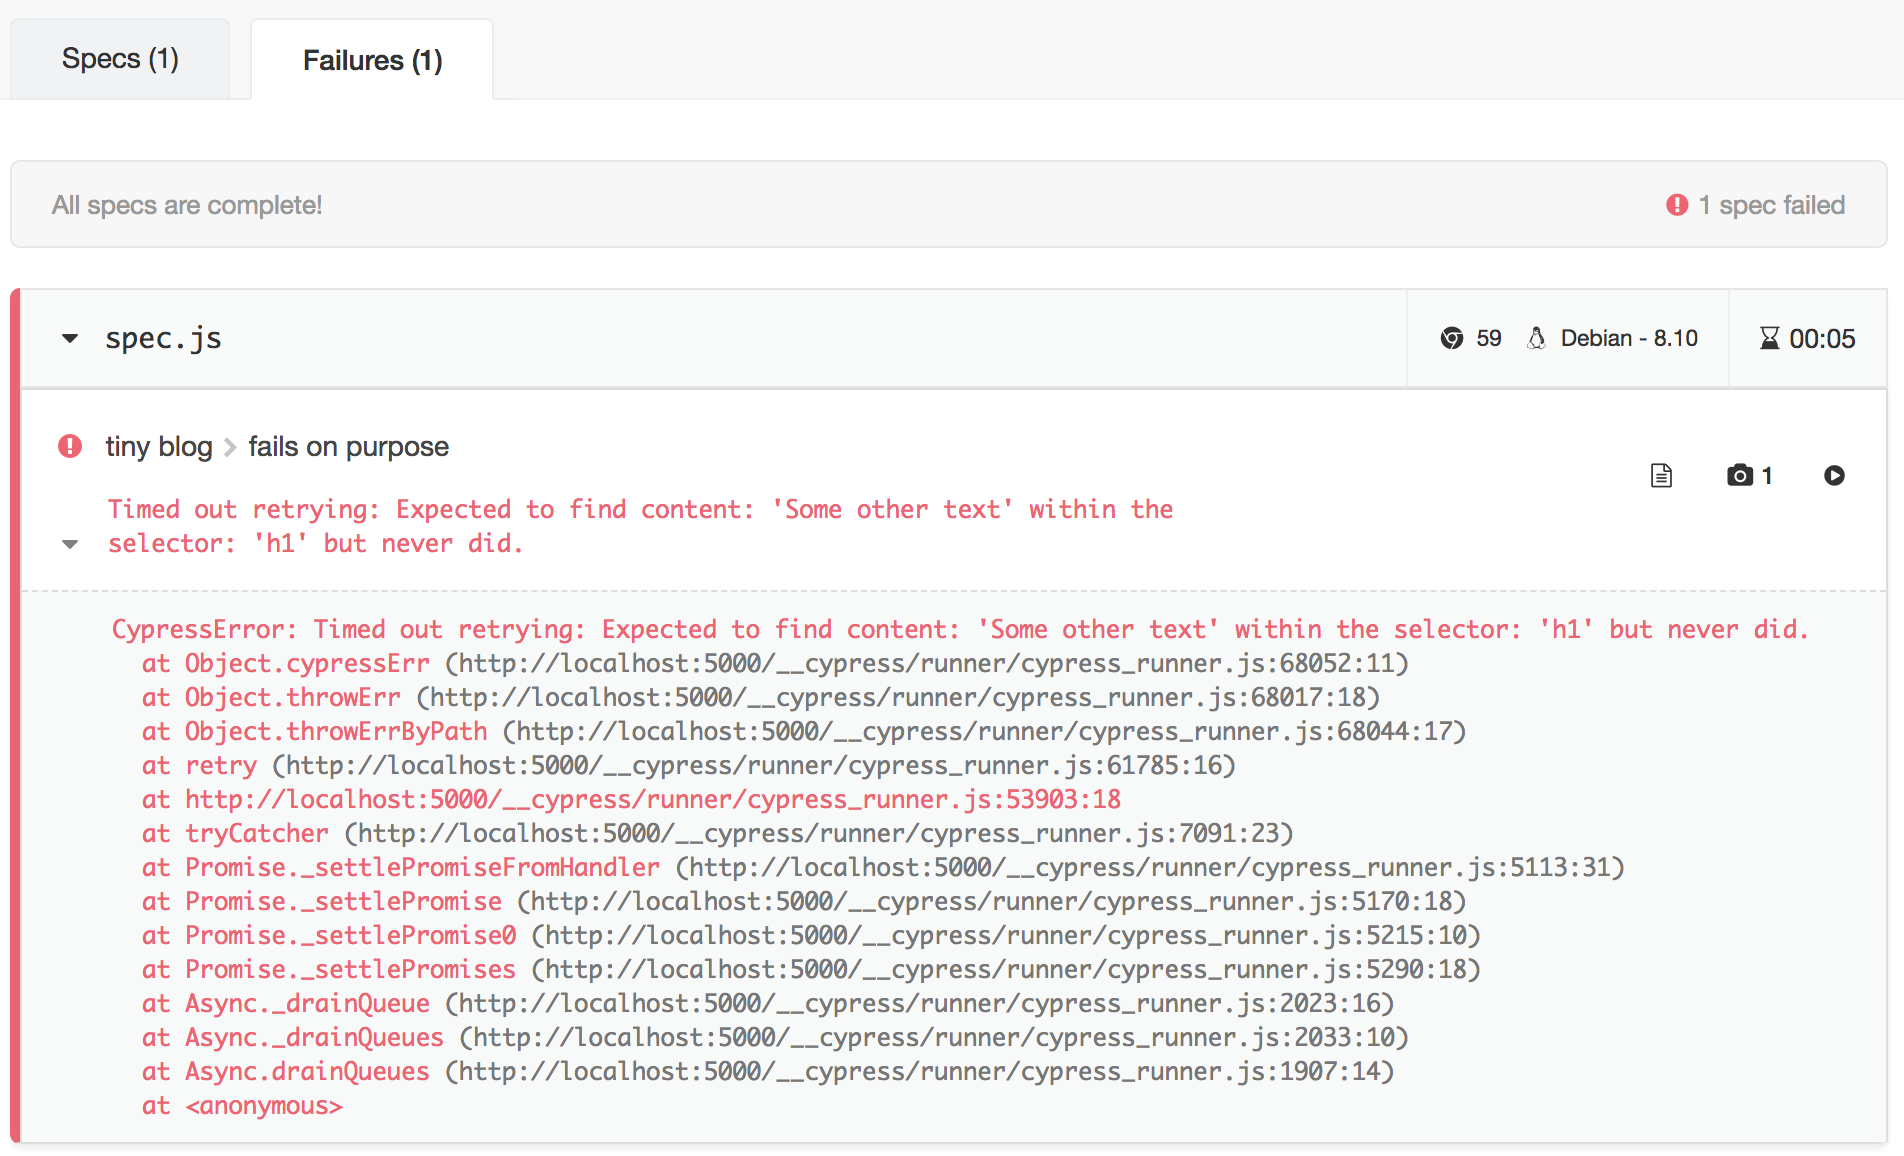
What happens when the build’s end-to-end tests fail? I have added a test that tries to find text on the page that does not exist:
// cypress/integration/spec.js
it('fails on purpose', () => {
  cy.visit('localhost:5000')
  cy.contains('h1', 'Some other text')
})
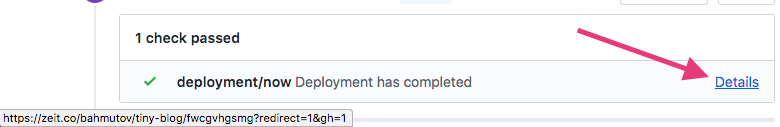
I have pushed a new branch with this failing test. You can see the pull request pull/10. The PR shows a failure.
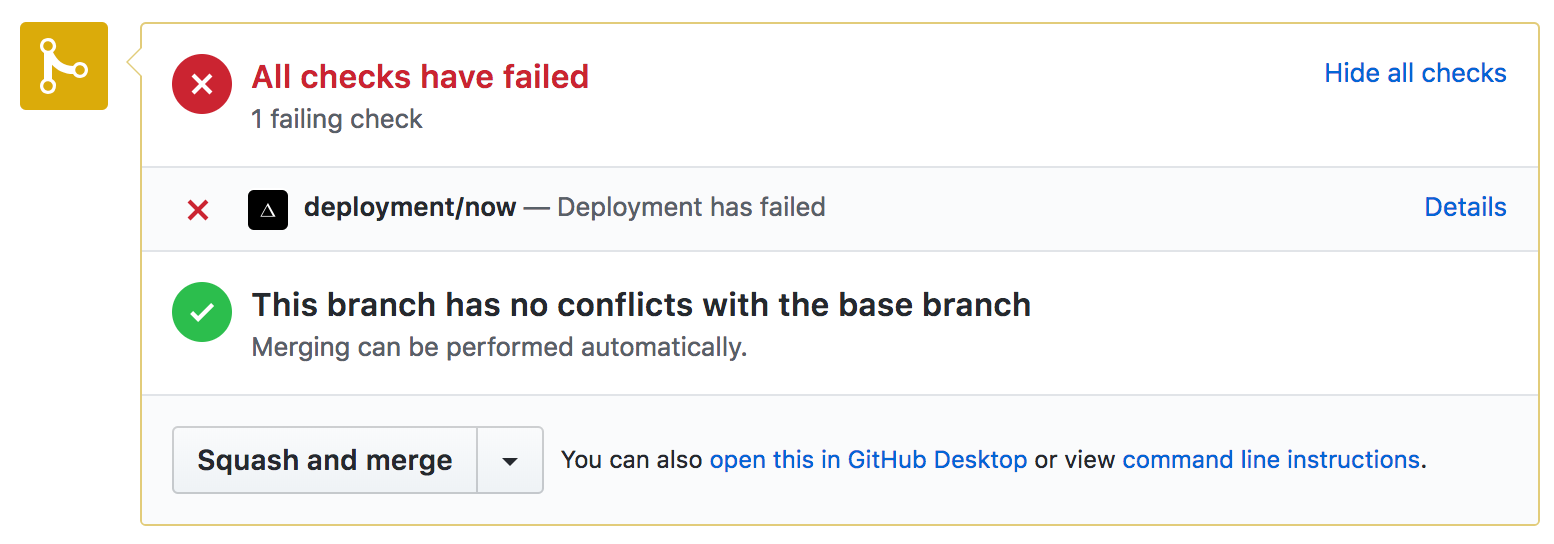
I can click on the details and see standard output from the Docker build command. It shows the Cypress output which kind of gives me an idea which test and assertion failed.
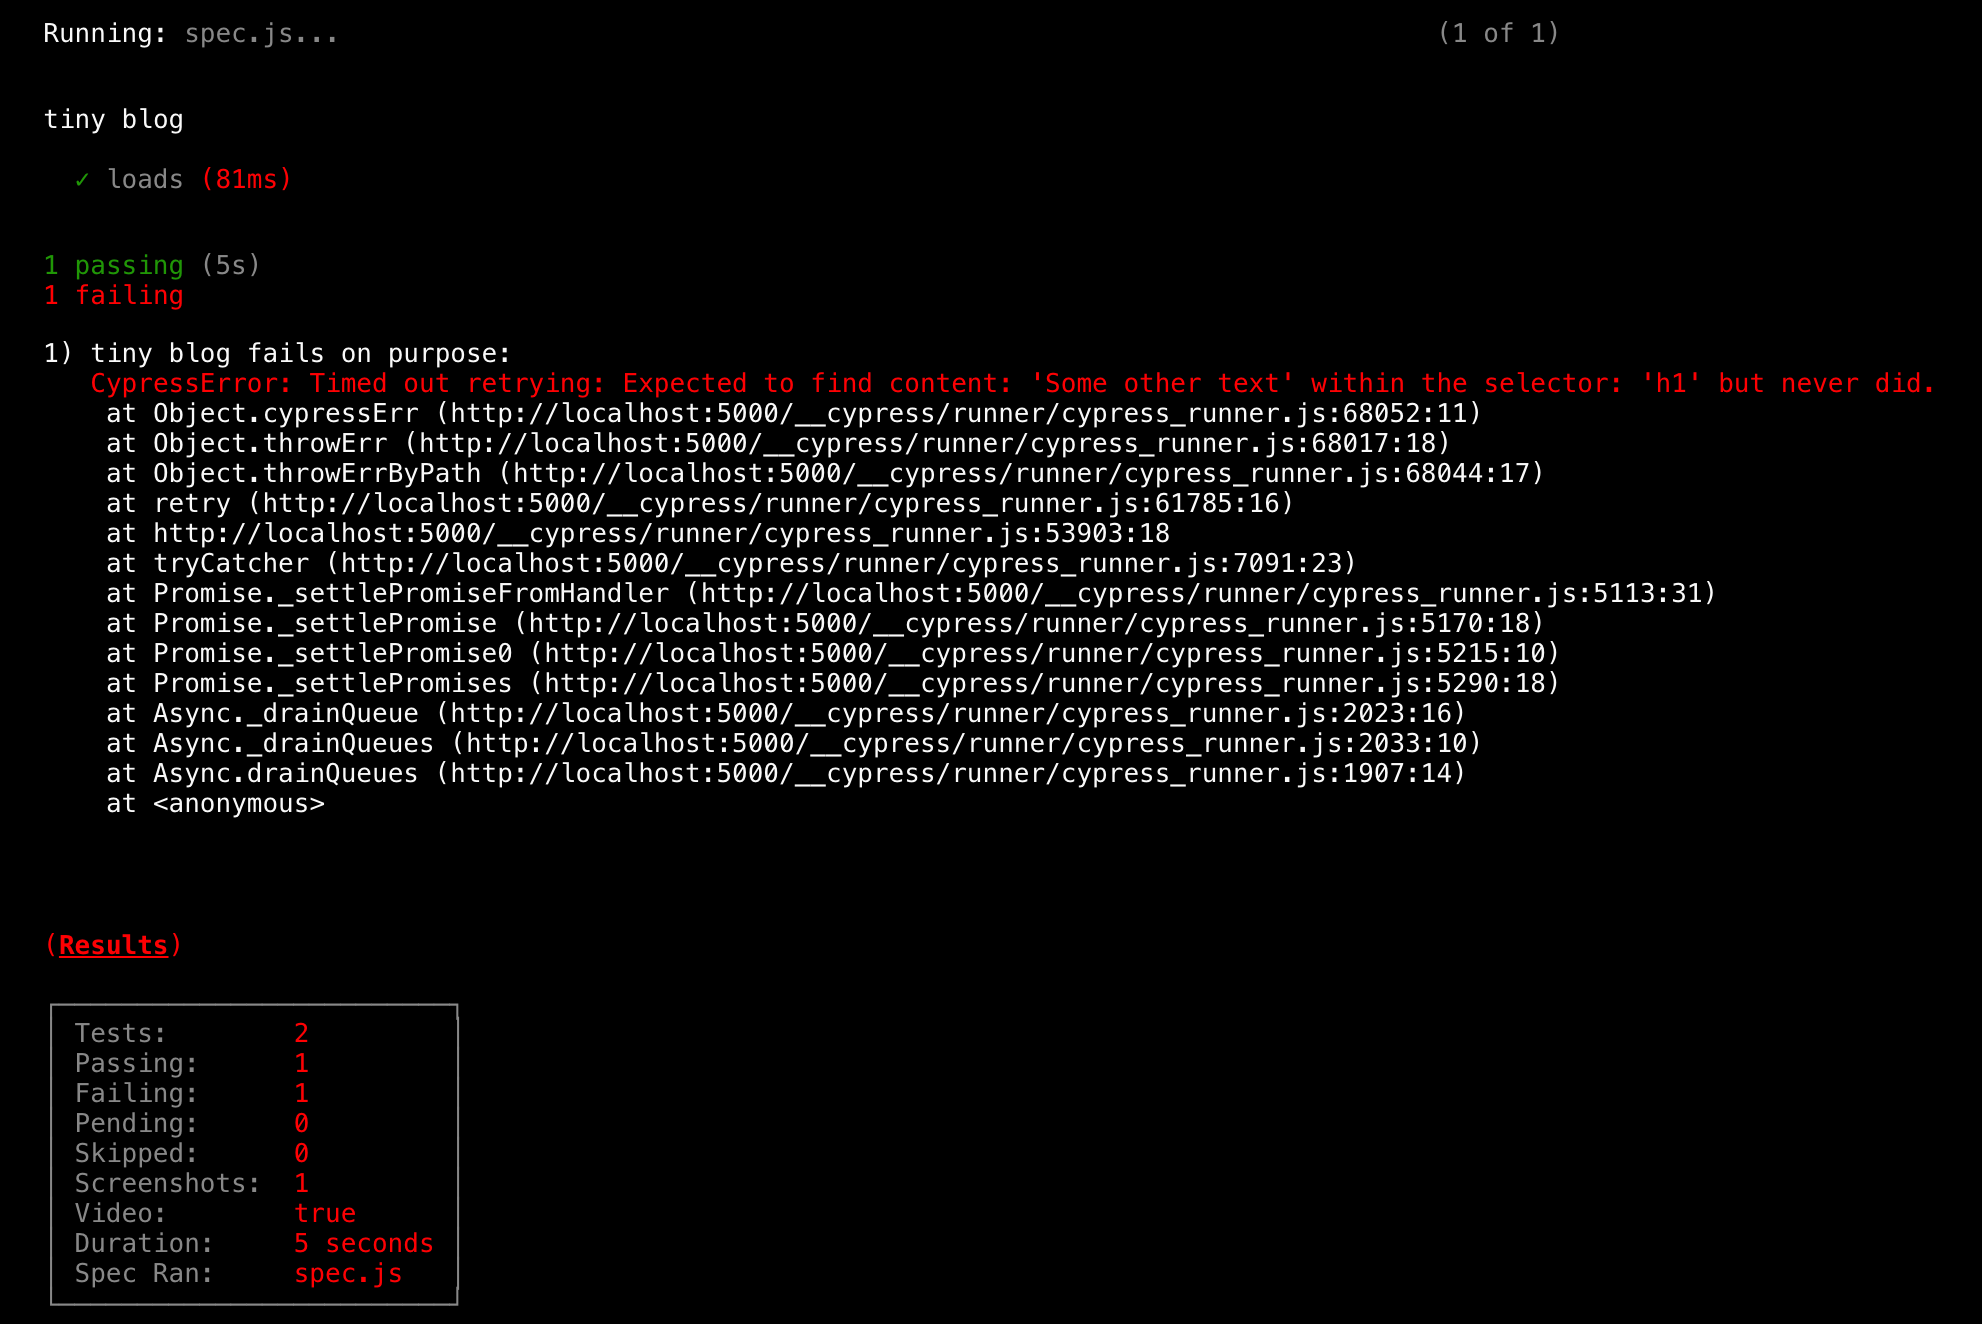
But what I really want to do is to open the screenshot image Cypress captures automatically on failure, and watch the video of the entire test run. I see from the output log that these were saved, so how do I get to them?!
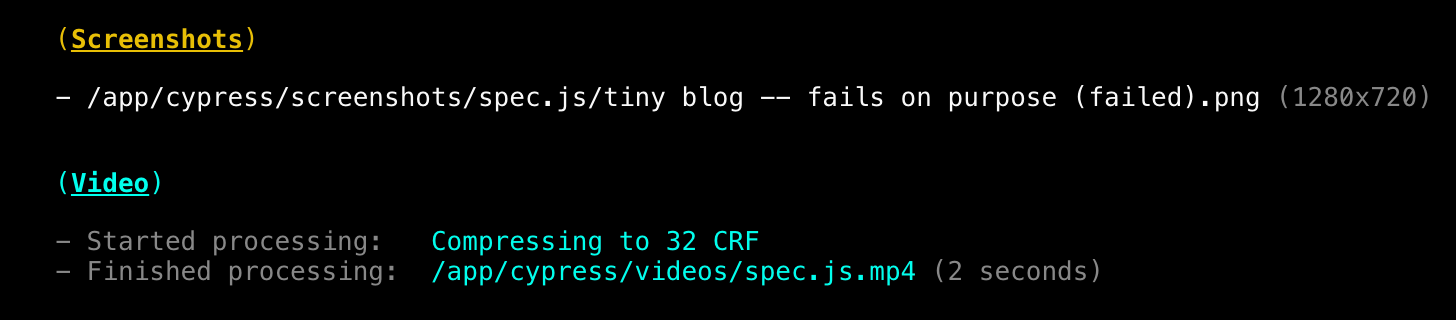
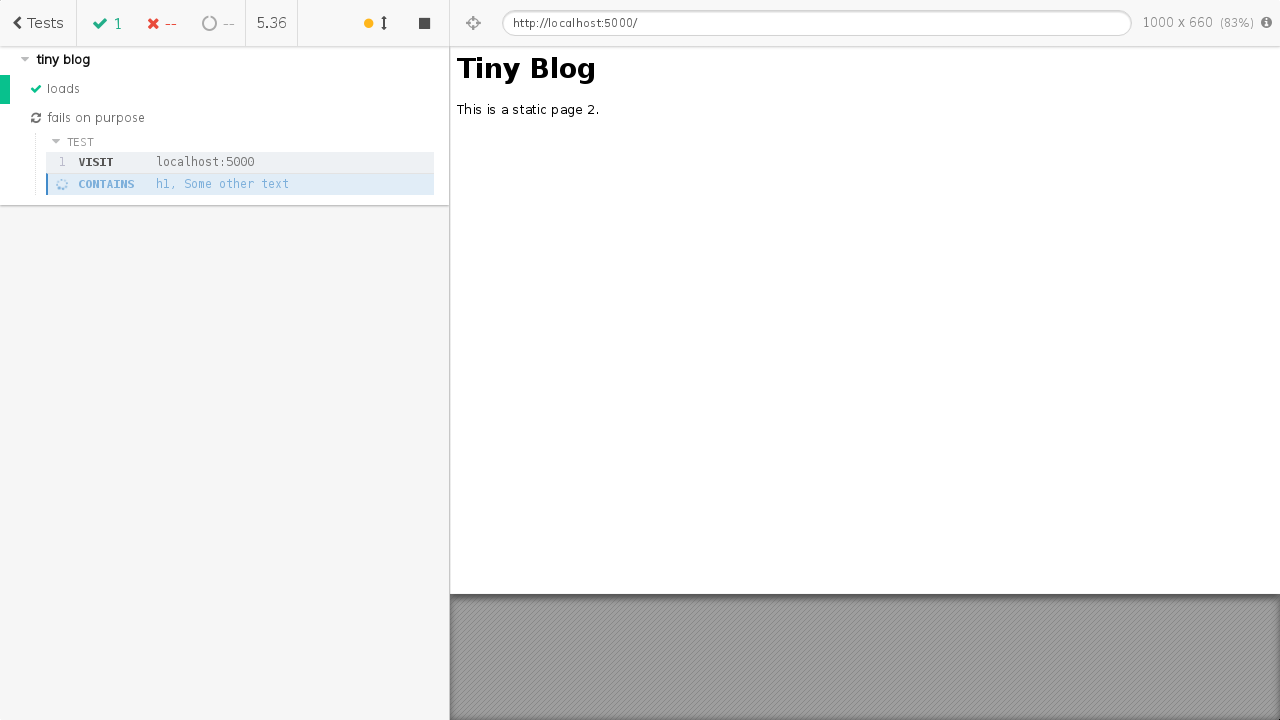
The screenshot and video of a test failure are extremely useful. Here is the screenshot file for example - it shows how the web application looked precisely at the moment of failure.
And here is the video of the test failure - imagine every failed test in the world recorded on video!
Setting up project to record
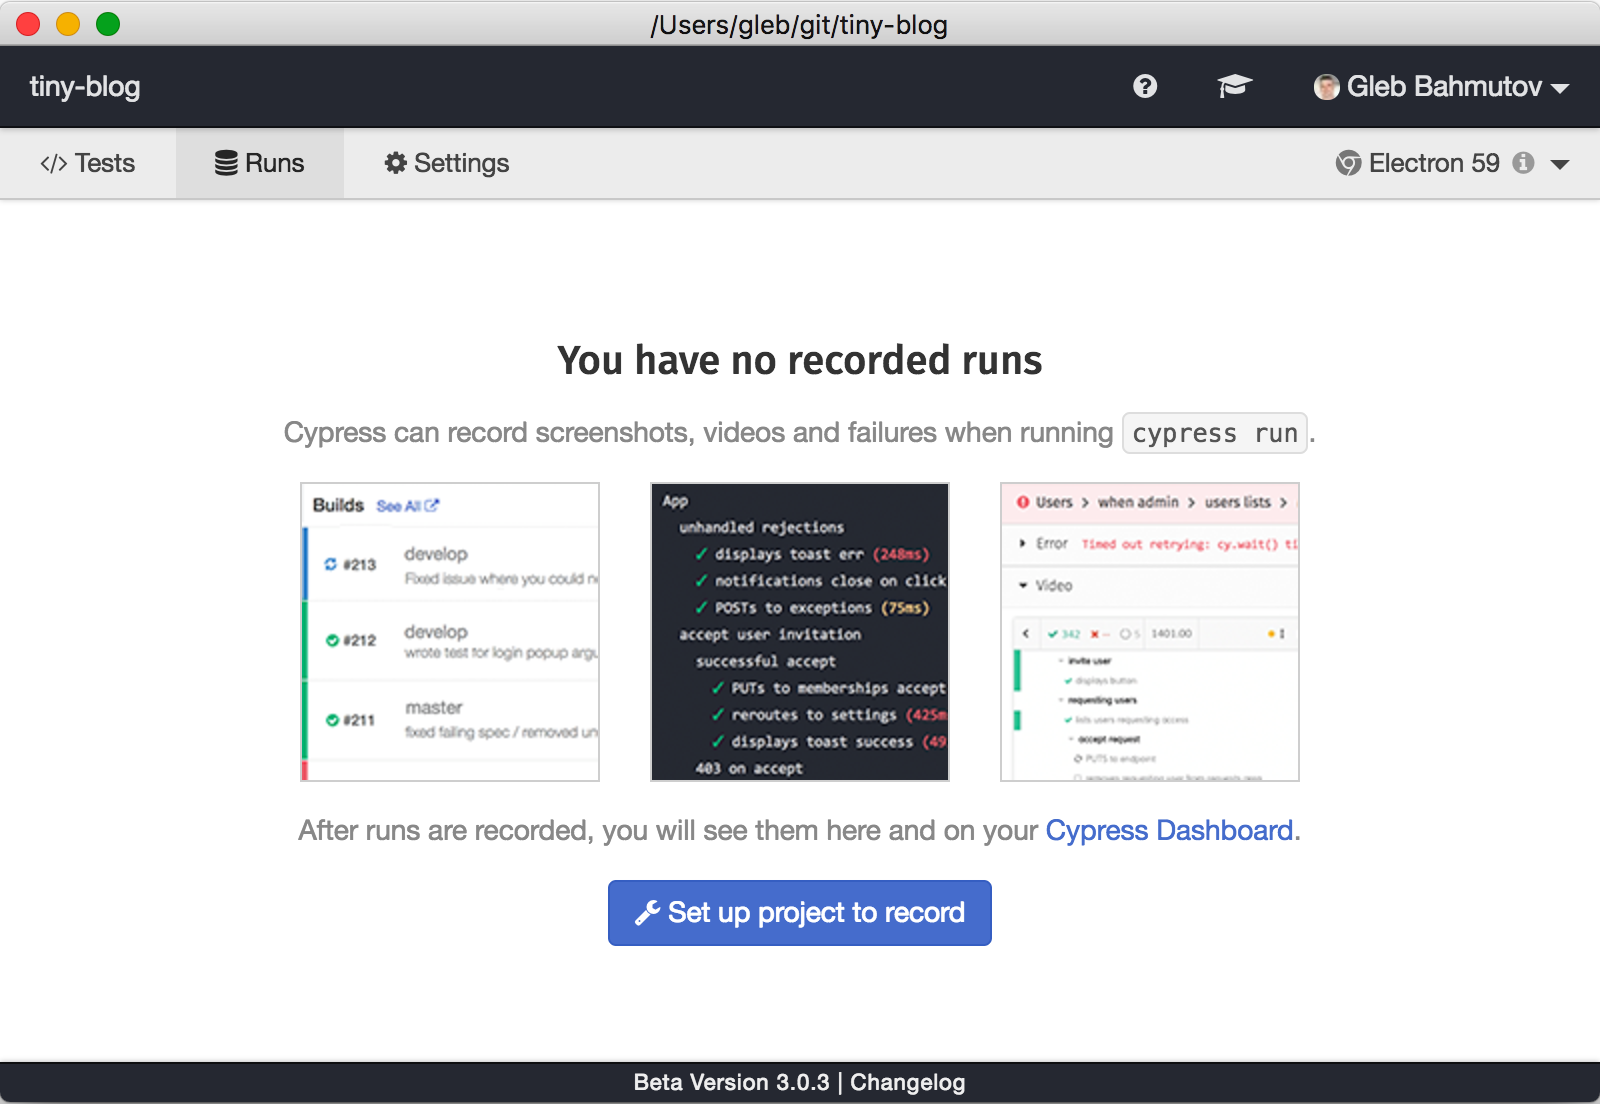
First, I will need to set up recording my project’s end-to-end test runs for the Cypress Dashboard. You can read the official documentation for the details, but this takes only a few clicks.
In the Cypress Test Runner click the “Runs” tab and then “Set up project to record”.
Pick “public” or “private” project visibility. Artifacts from the public projects will be visible to everyone so be sure that the videos and screenshots don’t reveal your secrets!
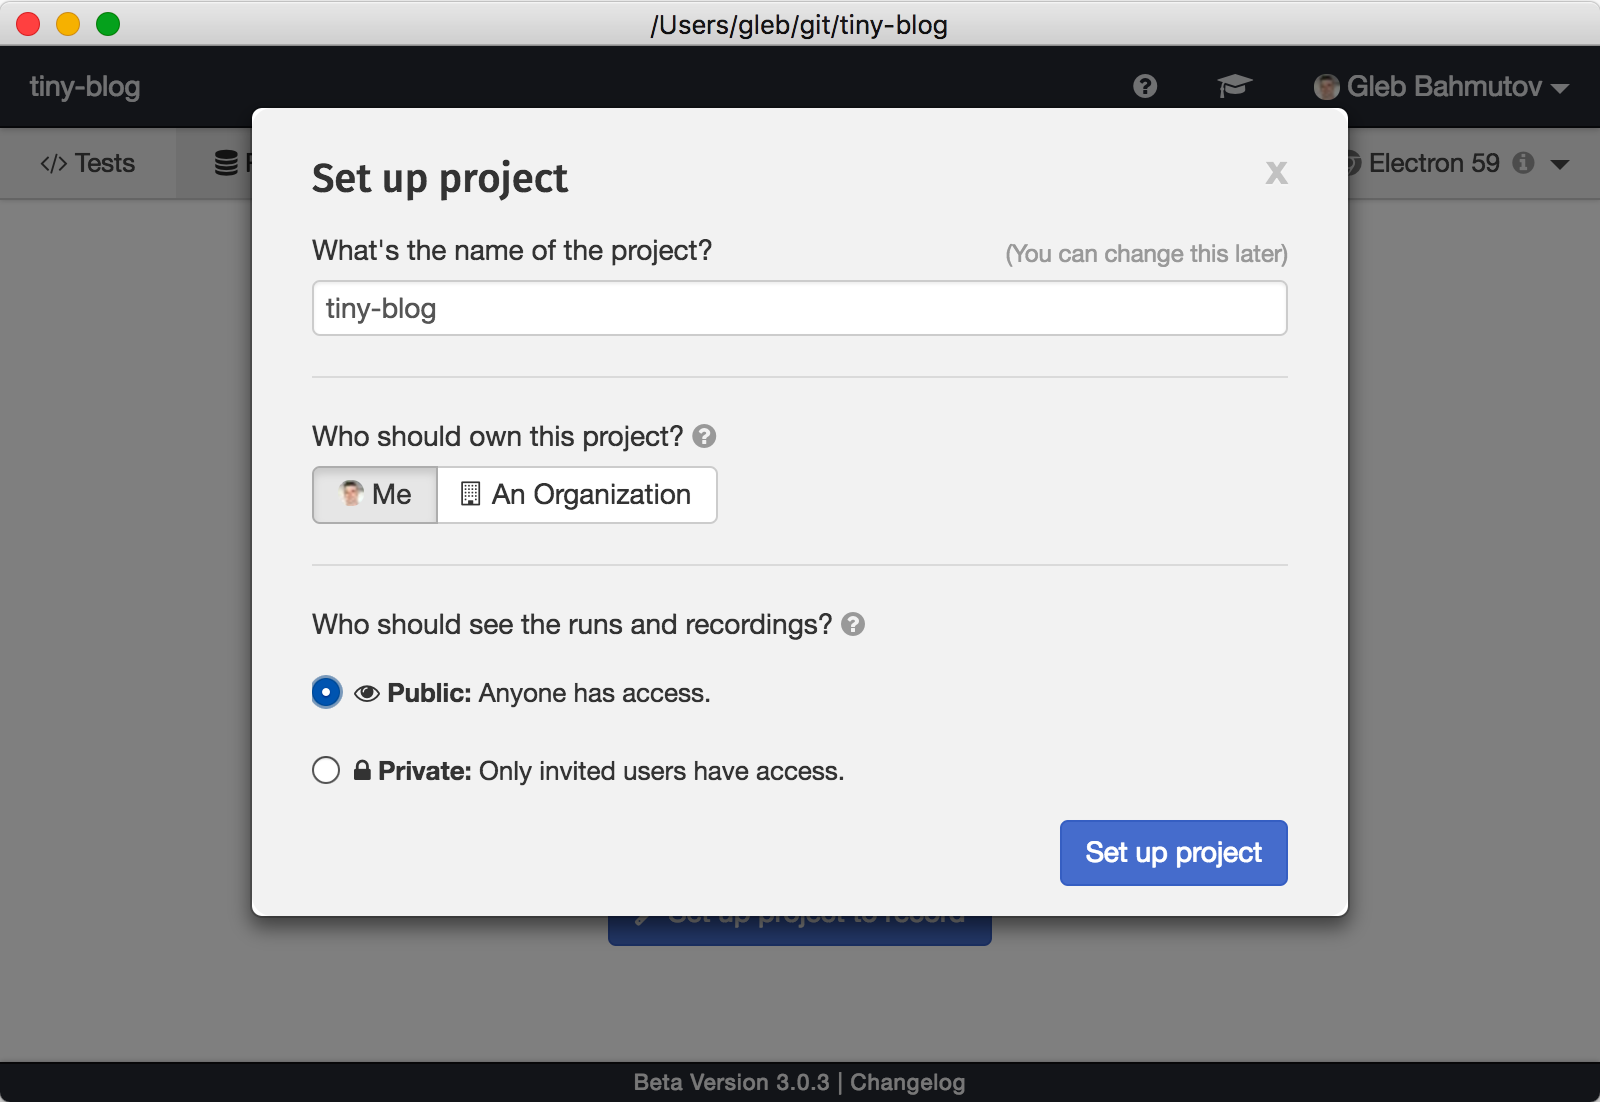
For this demo, I picked “public” because my example does not have anything confidential.
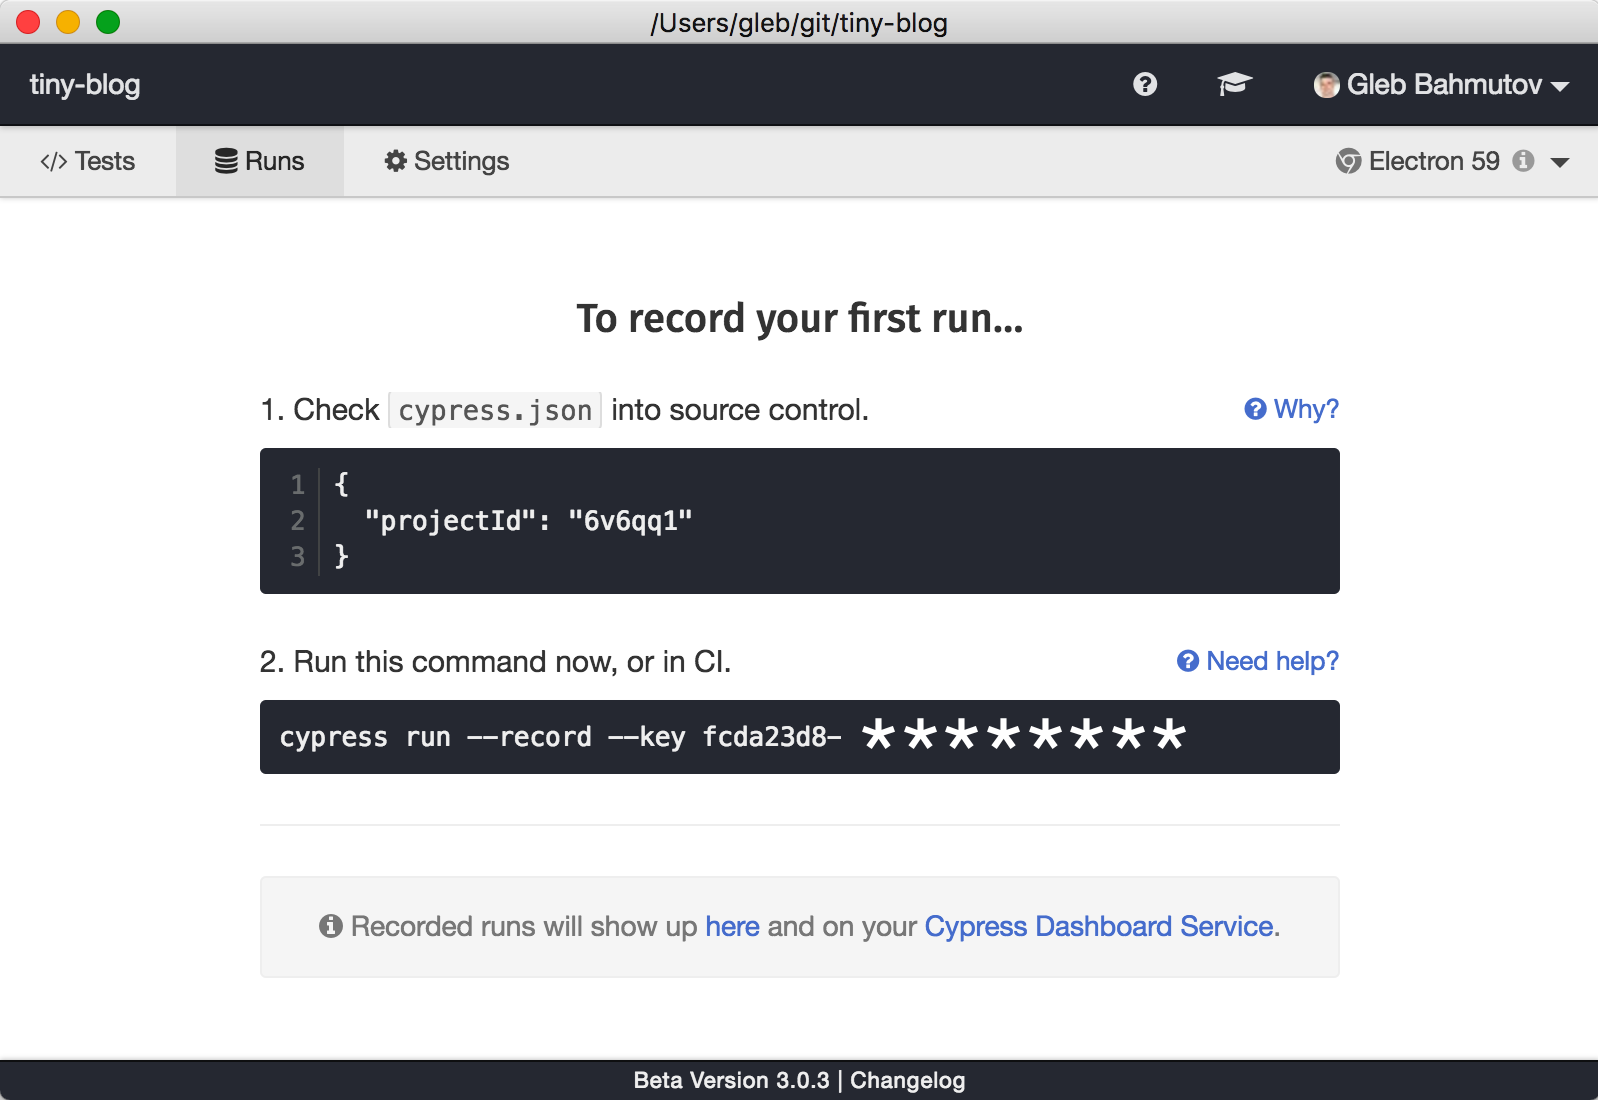
The test recording is all set! Next you should see the project ID (this value can be public, and by default it is automatically written into your cypress.json file when you set up the recording), and the unique record key. Keep the record key private! Always use the (encrypted if possible) environment variable CYPRESS_RECORD_KEY to pass this value in your CI.
To pass the secret record key to the Zeit Docker build process, I can follow Zeit’s “Using Secrets” documentation. From my terminal I will create a new secret variable.
$ now secret add tiny-blog-cypress-record-key fcda23d8-*******
and I will tell Zeit to set the environment variable during build using the now.json file.
{
  "type": "static",
  "build": {
    "env": {
      "CYPRESS_RECORD_KEY": "@tiny-blog-cypress-record-key"
    }
  }
}
The Docker build process has the environment variable set, and inside the Docker image we just need to explicitly say that we are accepting its value. Here is the relevant portion of the Dockerfile.
ARG CYPRESS_RECORD_KEY
RUN npm run test:ci
And for the last piece of the configuration - just tell Cypress to record to the dashboard. Change the CI command in your package.json from cypress run to cypress run --record.
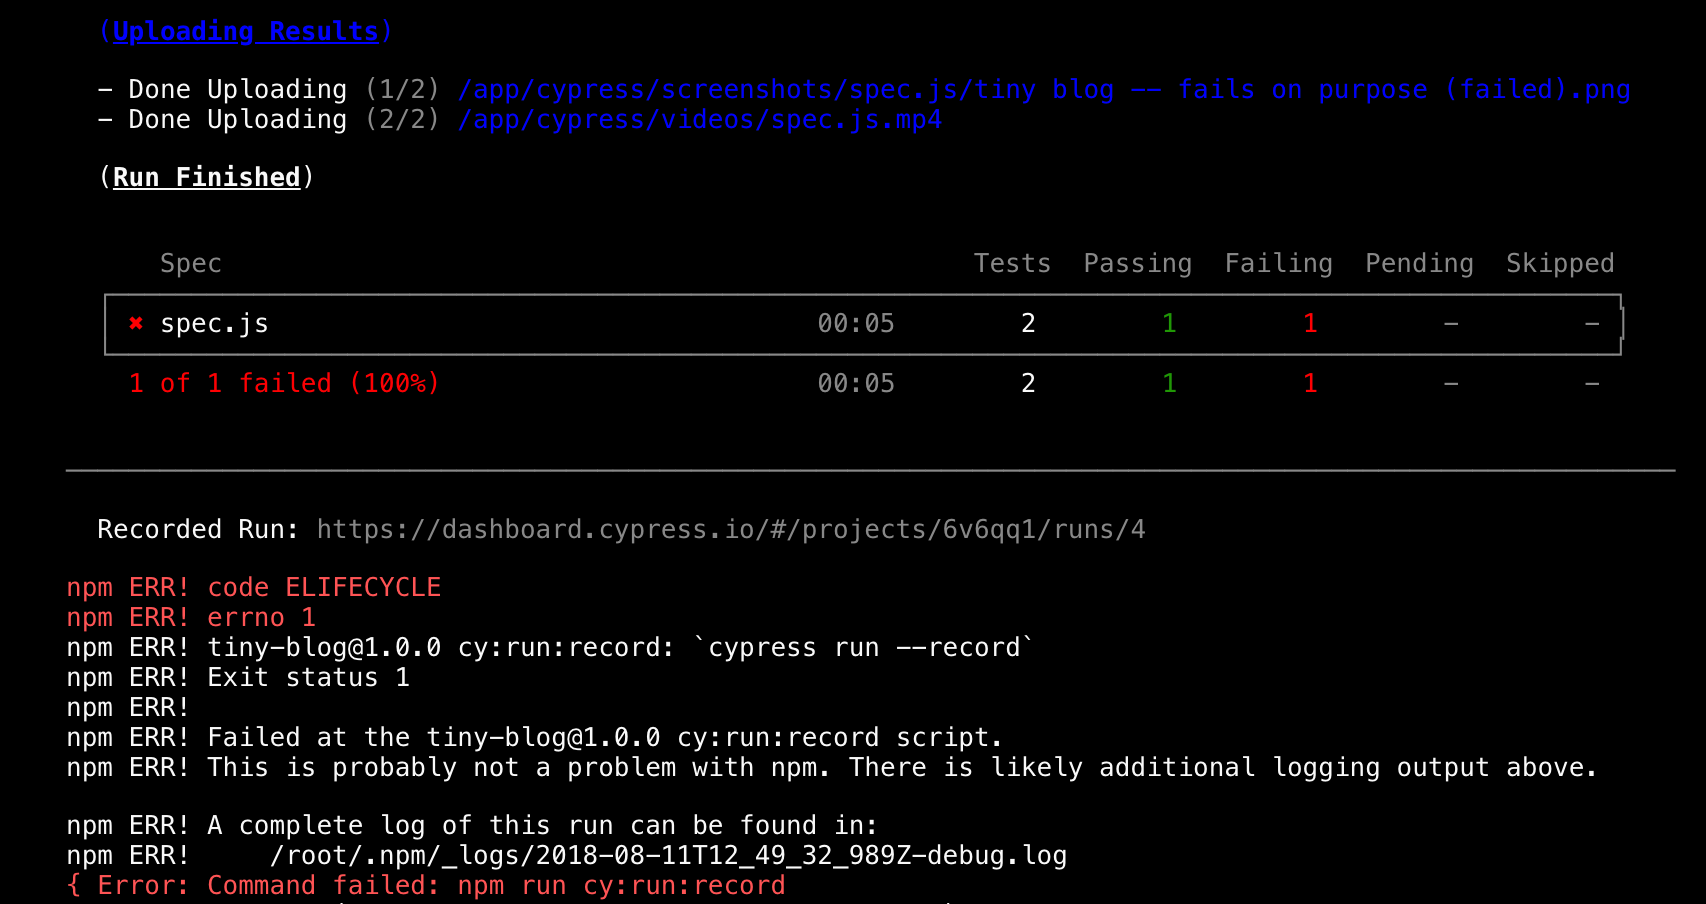
Voila! The failing pull request pull/10 is telling us that both the screenshot and the video were uploaded to the dashboard. The test run can be viewed at https://dashboard.cypress.io/#/projects/6v6qq1/runs/4
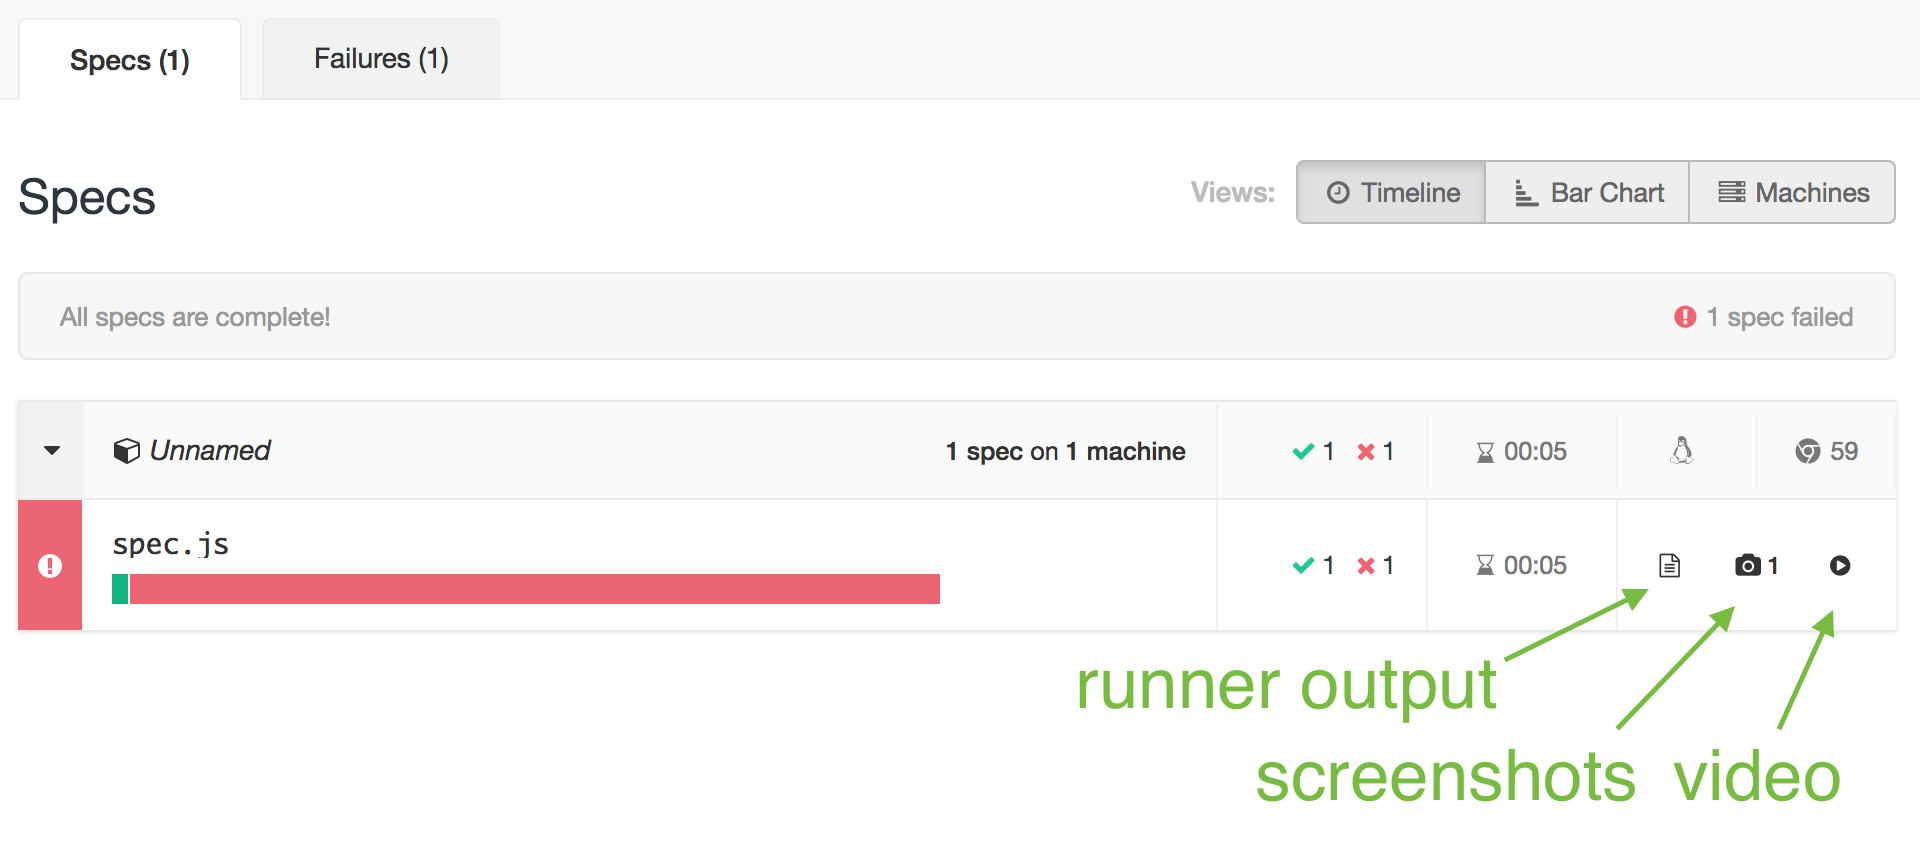
If you open the Dashboard url (you still need to login through GitHub to view the test artifacts, even for public projects), you will see each spec file, and can drill down into every failure.
By recording test artifacts on the Cypress Dashboard we can use a great CI system like Zeit’s Now today with minimum configuration. Same for other CIs - just use cypress run --record and everything necessary to debug the test failures will be collected. Then every developer can get insights into each test, how it ran, and if it has failed, why it has failed.
One last thing: if your CI system can allocate multiple machines, Cypress can load balance all specs automatically by simply adding the --parallel flag.