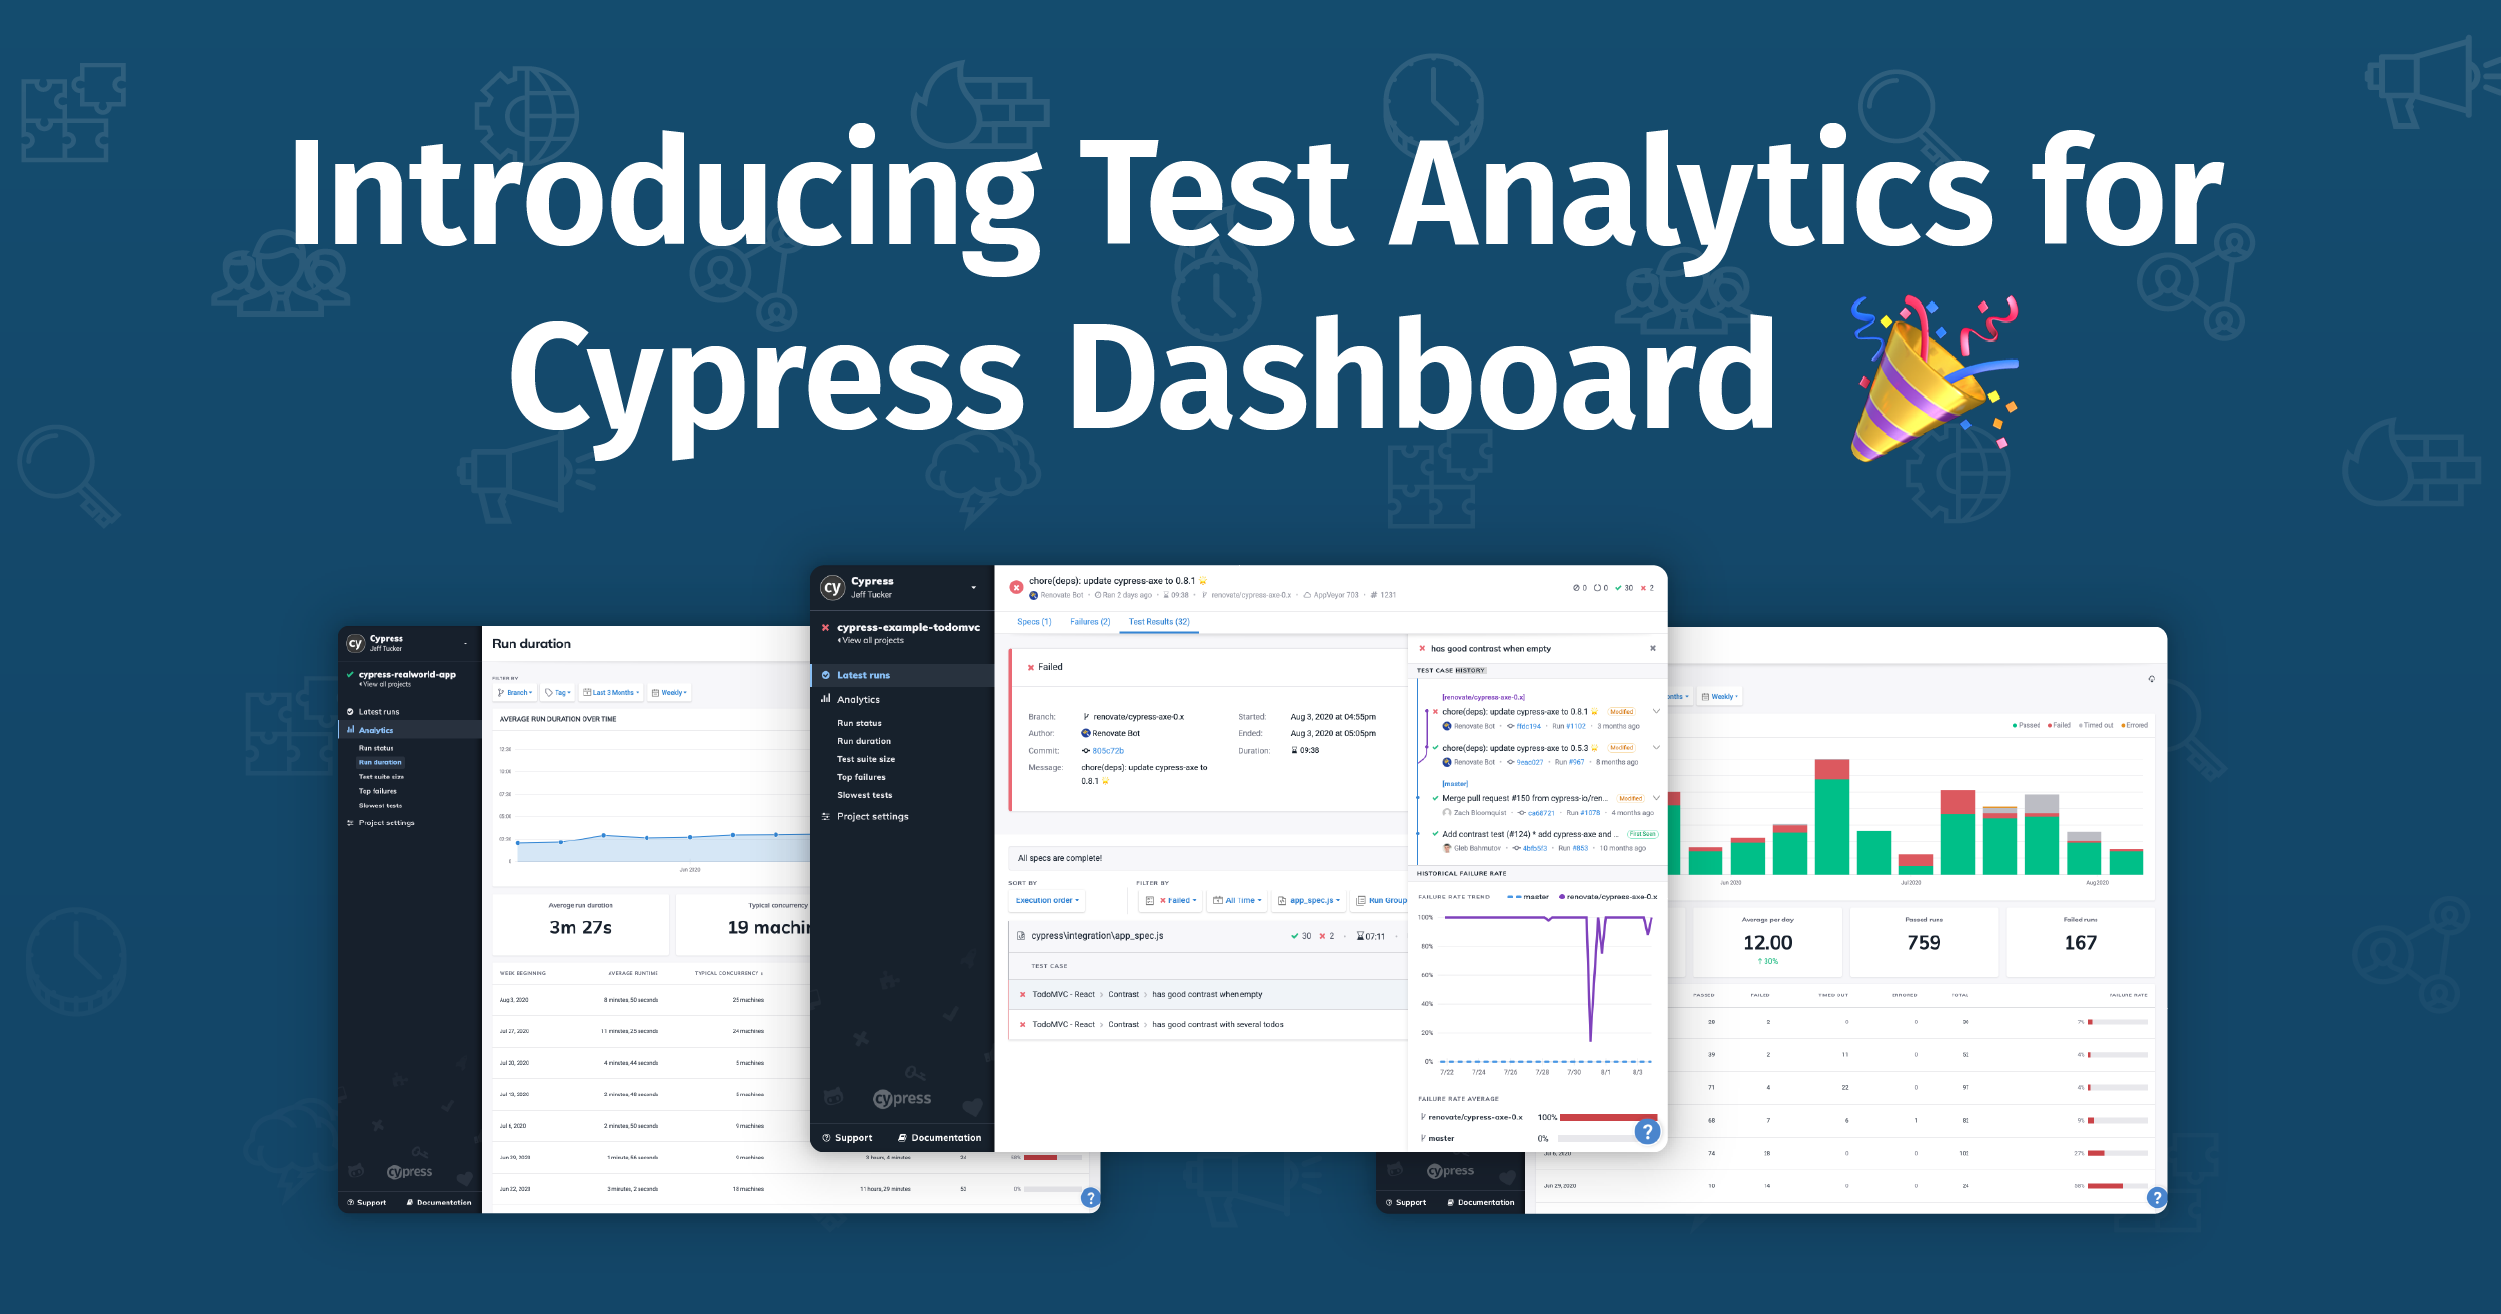
Today, we’re thrilled to announce our new Test Analytics for the Cypress Dashboard—a huge step forward in our mission to help teams easily manage and improve their test suites, so developers can build better things with confidence.
This dynamic update to testing insights for our users includes four major features: top failures, slowest tests, test case history, and project analytics. Dashboard users can now find the troublemakers in their test suite, manage issues with ease, and unlock a deeper, unprecedented understanding of their tests.
Top Failures
Find the most unreliable tests in your suite.

Identify your most unreliable tests with failure rate analysis—view the holistic failure rate of your test suite, or the failure rate of individual test cases. This feature automatically sorts your “top failures”, so you can see the failure rate of your top failing tests cases and address problems more quickly. You can also use the “View by” feature to see which specs, tags, or branches have the highest failure rates. Additionally, you can filter your top failures by browser, spec files, and more.
Slowest Tests
Find the slowest tests in your suite.

With slowest tests, see a high-level summary of how long a test case usually takes and get a better understanding of the distribution of fast vs. slow tests in your suite. This feature automatically lists out the slowest tests in your project, and allows you to highlight the performance of the latest revisions of your test cases.
Test Case History
Find out how your tests are changing over time.

While failure rate & top failures help pinpoint the biggest troublemakers in your test suite, Test Case History lets you quickly see how your tests have changed over time, so you can get to the root cause of test failures. With Test Case History, you can easily review changes to a test case that occurred on the current branch or projects integration branch. Want to dive deeper? See your test case’s historical failure in your run details rate to instantly identify when failures occurred. You can also drill into specific changes to see what exactly occurred within the test, and filter test cases by those that have changed most recently.
Project Analytics
Uncover the trends in your test suite.

Finally, get a high-level overview of how your projects are trending over time with these three analytics: runs recorded to dashboard, run duration, and test suite size. These project analytics allow you to gather holistic details about your test suite, and make more informed decisions about your testing strategy. Get even more detailed analysis by filtering runs by branch, time range, and time interval.
What’s Next?
Ready to get started with Test Analytics? Log in or sign up for the Dashboard to get started, or visit our docs for more information.
Stay tuned—this release is just the start of our goal to give our users unparalleled insight into their test suites. If you have ideas for more analytics you’d love to see in the meantime, give us a shout on Twitter!
Thanks for reading, and as always, happy testing! 🎉